You're looking at last month's cash balance, an ageing sales pipeline and a budget that hasn't been touched since the last board pack. A large customer has delayed a decision, but the team still needs to decide whether to hire, order stock or hold off on spending. The forecast in the spreadsheet may be neat, but unless it helps make those choices, it isn't doing its job.
For New Zealand small and medium-sized businesses, business forecasting methods matter less than the decisions they support. Start with usable data, build a range of plausible outcomes, and make experienced judgement visible. A forecast isn't a promise about what will happen. It's a management tool you revisit as the evidence changes.
Why Most NZ SMB Forecasts Fall Apart Before They Start
The warning signs tend to appear in ordinary operating decisions. Sales come in below plan, but nobody can point to the assumptions that drove the revenue line. A manager asks to hire after the team has already been stretched for months, yet the cash impact of that decision hasn't been tested. The profit and loss forecast looks acceptable, but cash runs short because customers pay later than expected or a large expense lands earlier than planned.
These problems don't necessarily mean the business needs complex software. Often, the underlying issue is that nobody owns the forecast after it's prepared. The spreadsheet keeps circulating, but pipeline stages, expected payment dates and cost assumptions go stale. When conditions shift, staff make decisions from different versions of reality.
A forecast should answer a practical question: what decision will change if this number moves? A sales projection might inform staffing or stock orders. A cash forecast might show whether the business can meet upcoming commitments without relying on a late customer payment. Those are different views, and they may need different inputs and time horizons.
For a founder building a repeatable roadmap, the Accountant She Ltd forecasting roadmap can provide a useful starting point for structuring the work. But the template isn't the discipline. Someone still needs to own the assumptions, update the inputs and compare the forecast with what transpired.
Practical rule: If a forecast can't change a hiring, spending, pricing or funding decision, it's probably reporting history rather than helping manage the business.
Treat forecasting as a recurring management process. Name the decision, record the assumptions, compare predictions with actual outcomes, and investigate meaningful differences. That turns a forecast from a once-a-year estimate into something the team can learn from and use.
The Four Families of Business Forecasting Methods
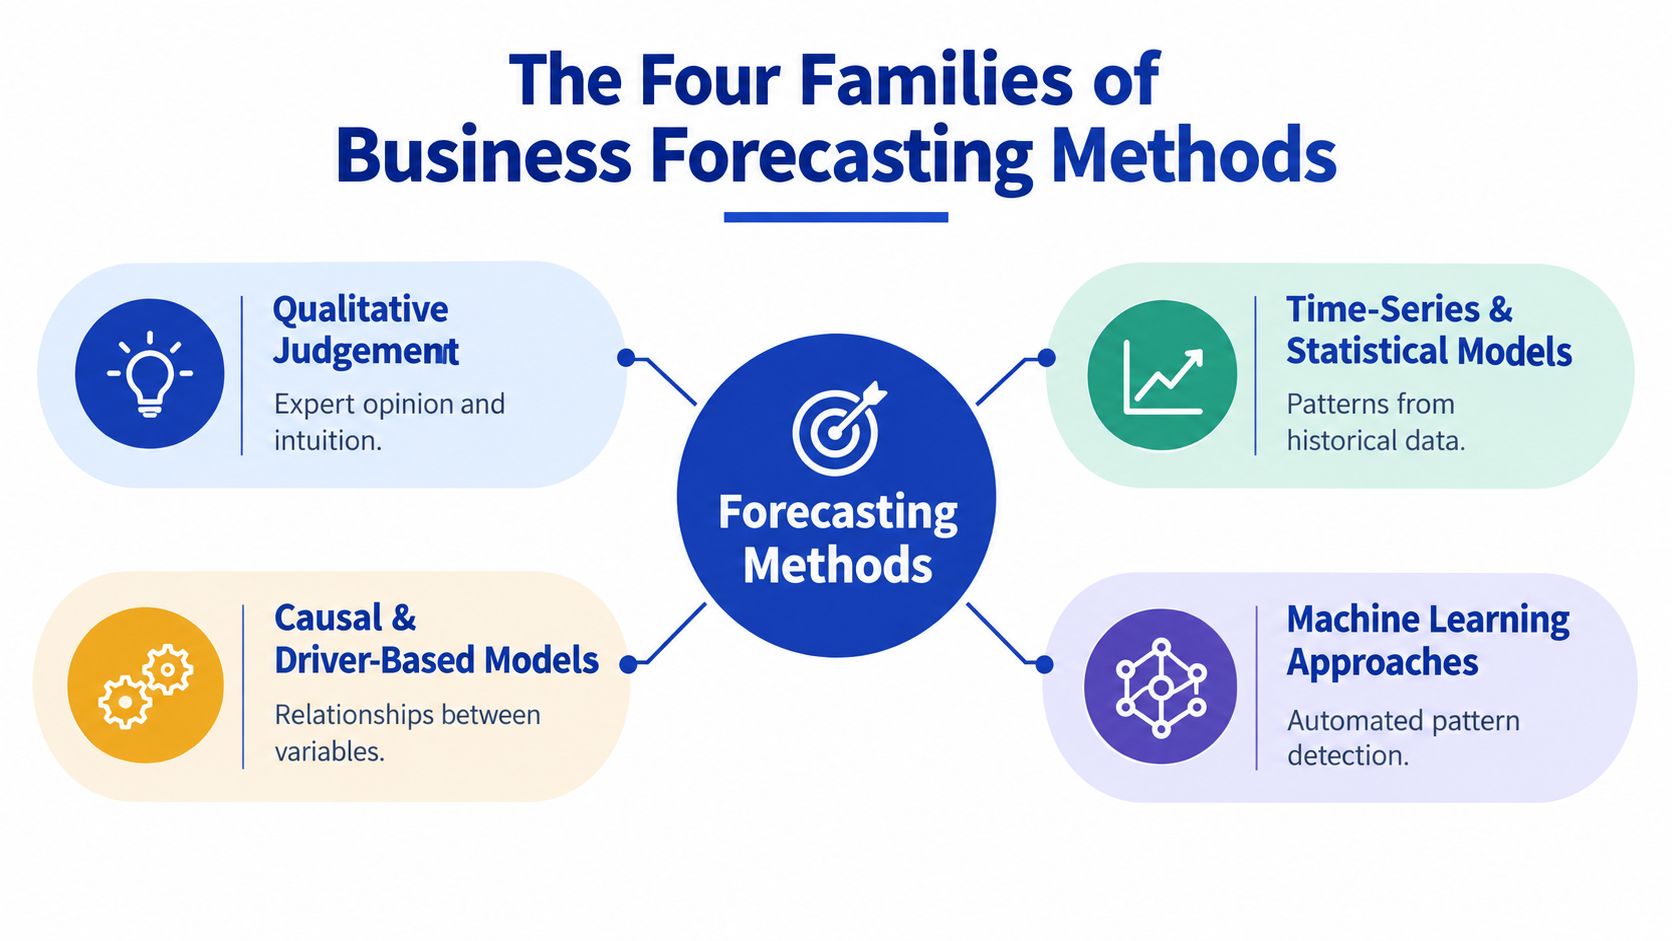
Most business forecasting methods fit into four families. Each offers a different way to deal with uncertainty, and none should be chosen just because it sounds complex.
Qualitative judgement
This method uses knowledge from people close to customers, suppliers and delivery. Think of asking experienced salespeople what next quarter looks like, then asking them to explain why. Their input can help when a new service has little history or a customer's buying plans have changed. The risk is that confident opinions, optimism or recent wins can overpower evidence. Record the assumptions and ask for reasons, not just a number.
Time-series and statistical models
A time-series model looks at past results in sequence and uses recurring patterns to estimate what may come next. It's like watching the same beach through changing conditions: previous swells can help you recognise a pattern, but they don't guarantee the next one. This family can be useful when historical sales, costs or demand are reasonably consistent. A moving average in a spreadsheet may be enough to start; more complex models need cleaner data and more care.
Causal and driver-based models
A causal or driver-based forecast asks what moves the outcome. Instead of extending revenue as a single line, a business might connect sales to quote volume, conversion, price or staff utilisation. The analogy is a set of linked gears: change one driver and the result can shift. This makes the model useful for testing decisions, provided the team can explain and support the relationships.
Machine learning approaches
Machine learning finds patterns across multiple variables. It isn't magic, and it shouldn't be treated as a black box that makes decisions for management. It needs relevant, dependable inputs and people who can interpret unusual results.
For a deeper explanation of forecasting fundamentals, see this Stewart Accounting Services forecasting guide. When forecasting feeds into broader business direction, it can also sit alongside strategic planning. In practice, the most useful approach often combines methods: models organise evidence, while managers test whether the assumptions still make sense.
Comparing Forecasting Methods Side by Side
The best method depends on the information you have and the decision you need to make. Start with the family that meets those needs without creating more maintenance than the team can sustain.
| Method family | Data required | Best horizon | Typical SMB use case | Skill and tool needs |
|---|---|---|---|---|
| Qualitative judgement | Current customer, supplier and team knowledge | Short or long, depending on the question | New service, major tender or changing customer plans | Structured interviews, documented assumptions and a facilitator |
| Time-series and statistical models | Consistent historical figures | Near-term to longer-range, depending on pattern stability | Sales, costs, demand or cash trends | Spreadsheet skills; statistical tools if complexity warrants them |
| Causal and driver-based models | Data on outcomes and the factors that influence them | Often near- to medium-term operational planning | Hiring, pricing, quote conversion or utilisation decisions | Finance and operational input, plus clear driver definitions |
| Machine learning approaches | Larger, well-organised datasets across relevant variables | Most useful where frequent signals and complex patterns exist | Demand signals, anomaly detection or detailed scenario support | Data governance, technical capability and human review |
Why the order matters
For most NZ SMBs, a sensible default is qualitative judgement plus a simple time-series view. Once accounting records, customer pipeline and operational data use consistent definitions, add the drivers that explain why results move. Test machine learning only when the business can maintain the data and evaluate whether the output improves decisions.
That sequence is consistent with the value of measuring forecasts against results. A Treasury review assessed forecasts from one quarter ahead through 20 quarters ahead. It found no statistically established directional bias across those horizons, reported that forecasts compared favourably with other available forecasts in most years from 2000 to 2017, and found a steady, marginal improvement in GDP-growth and inflation forecast accuracy after 2013. Real GDP growth forecasts seven quarters ahead were more accurate than those of other forecasters. The practical lesson for businesses is to set the horizon explicitly and review forecast accuracy, rather than assume one approach works equally well for every decision (New Zealand Treasury forecast performance review).
Don't select a method because it's fashionable or because a vendor promises automation. Choose it because it fits the decision, available evidence and skills of the people who'll maintain it.
A Practical Six-Step Implementation Path
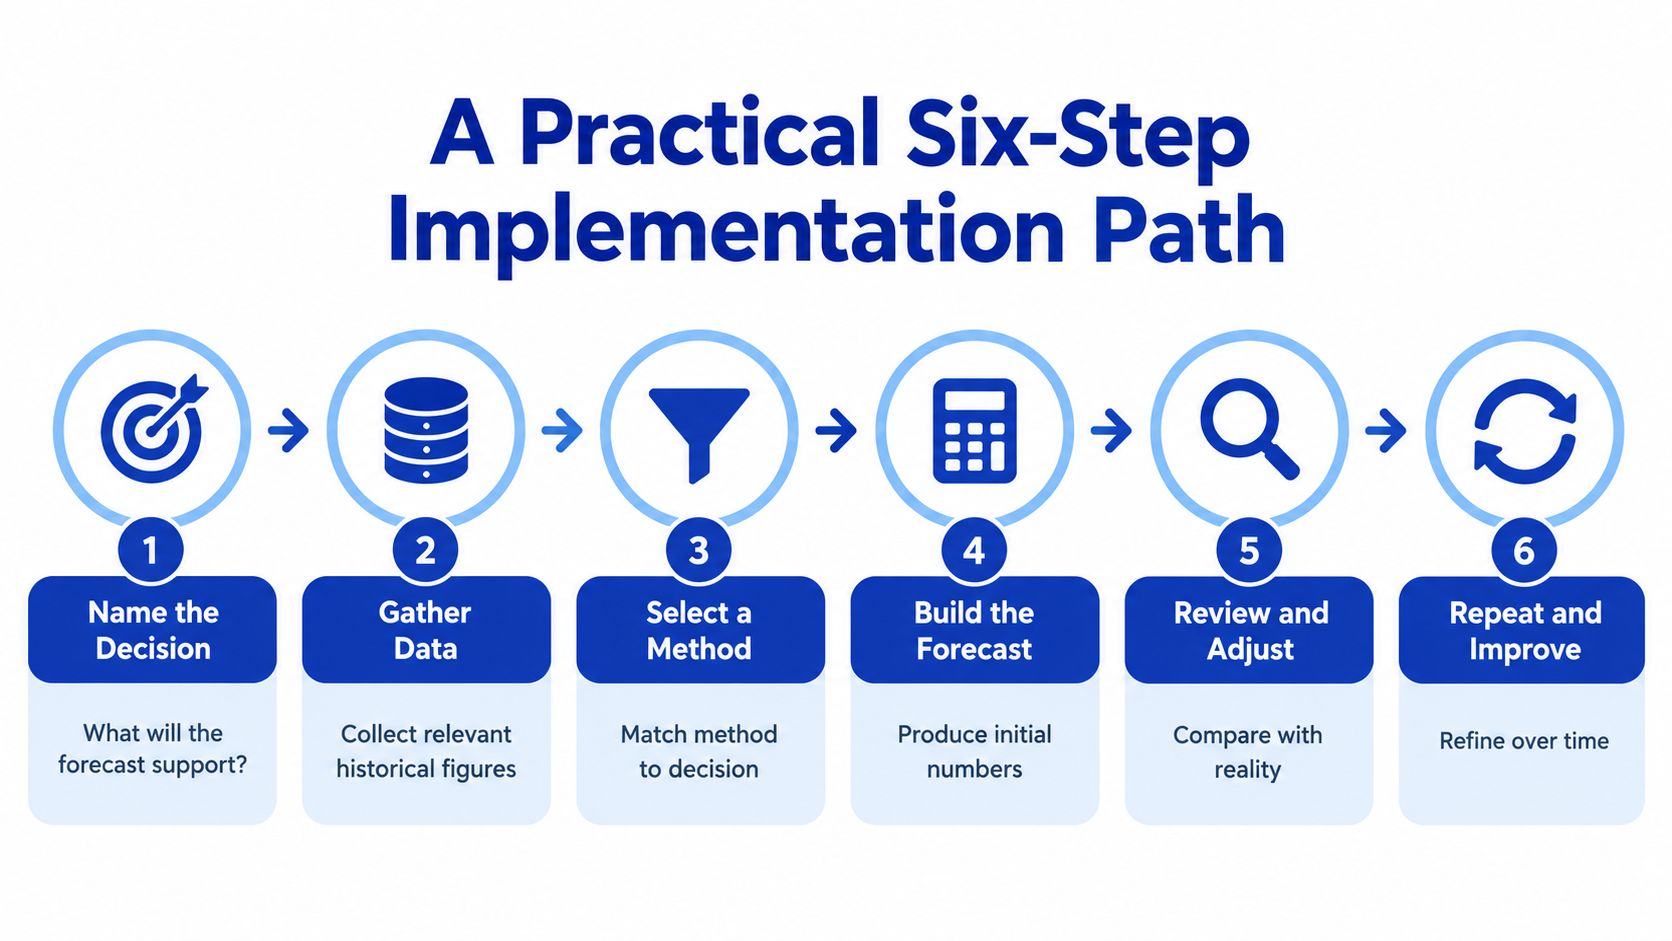
A forecast process doesn't begin with a spreadsheet. It begins with the decision the business needs to make, then builds a clear line from evidence to action.
Start with the decision and its requirements
Name the decision. Be specific: are you deciding whether to hire, raise prices, order stock or draw on a facility? The answer determines which information belongs in the forecast.
Define the measure and horizon. A hiring decision may depend on workload and expected revenue, while a funding decision depends on when cash enters and leaves the bank account. Write down the metric, period and how much uncertainty the decision-maker can tolerate. The output is a short forecast brief, not a vague request to “predict performance”.
Check the data before choosing a method
Audit the sources. Review accounting, CRM, project and payroll records. Identify who maintains each system, which fields matter, and where information is missing or inconsistent. The artefact should be a data map that names sources, owners and known gaps.
Choose the simplest suitable method. A rolling, driver-based forecast is often more useful than a static annual budget because it connects assumptions to actual operating activity. But don't add complexity if the source data can't support it. Write down why the method fits and what it can't tell you.
Build ownership and a review cycle
Document assumptions and ownership. Record how the team defines revenue, backlog, costs and expected payment timing. Assign a person to each key input, so the forecast doesn't depend on one staff member remembering how a spreadsheet works.
Recalibrate and learn. Compare forecast with actual results, investigate meaningful differences, and decide whether the cause was timing, an unusual event or a flawed assumption. Update the assumptions and record the change. A monthly review rhythm can make this a manageable management habit rather than a major rebuild each time.
The result is more than a set of numbers. It's a repeatable cycle: decision, evidence, forecast, review and adjustment. The first version doesn't need to be perfect. It needs to be clear enough that the team can use it, challenge it and improve it.
Where Machine Learning Actually Helps
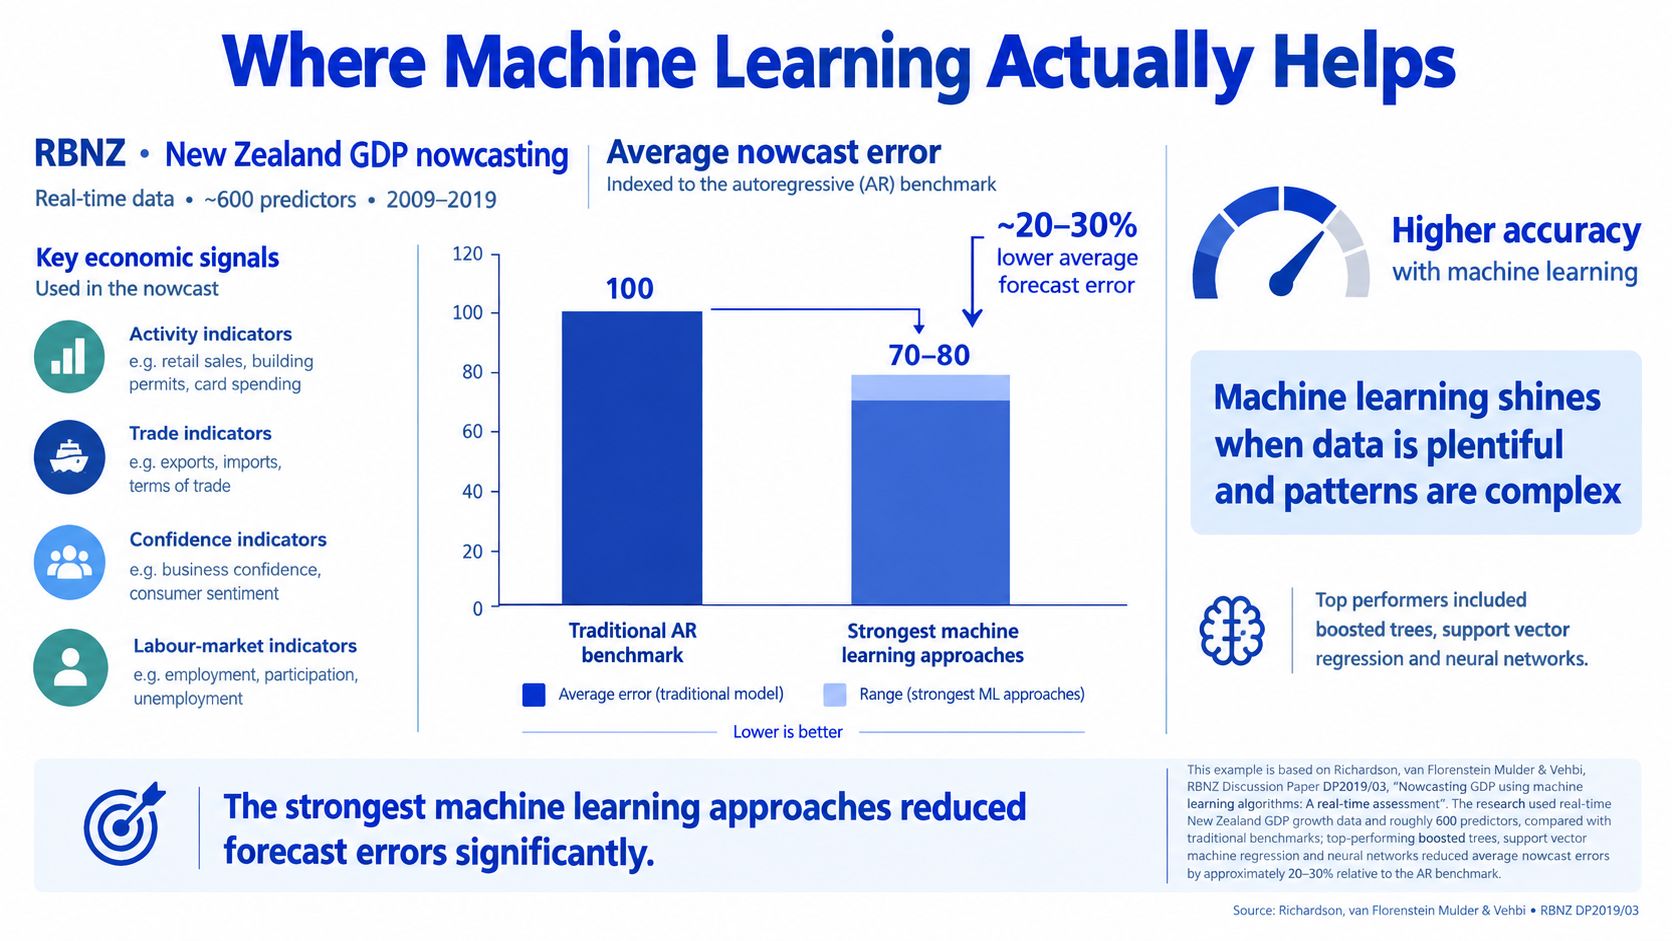
Machine learning is useful when it can identify a signal that a simpler approach might miss. That doesn't make it the right first step for every business. The Reserve Bank of New Zealand offers a useful example of the distinction between adding a model and handing it the decision.
Its nowcasting approach uses timely information such as business surveys, financial markets, consumer spending, traffic movements and internet-search trends to estimate current economic conditions ahead of official statistics. The Reserve Bank's methods range from indicator regressions and dynamic-factor models to MIDAS models and machine learning. In a real-time assessment, the strongest machine-learning approaches, including boosted trees, support-vector-machine regression and neural networks, reduced average GDP nowcast errors by approximately 20–23% compared with an autoregressive benchmark (Reserve Bank of New Zealand forecasting speech).
The finding isn't a guarantee that a small firm will get the same result. The Reserve Bank describes its forecasts as model-supported rather than model-driven, with experienced economists playing a vital role in final projections. That's the right principle for an SMB too: use a model to surface signals, then ask an accountable person to interpret them.
A smaller business might test machine learning for short-horizon demand signals, anomalies or scenario generation after its revenue, pipeline and operating data are consistently recorded. If CRM stages are stale, customer records are duplicated or staff routinely override fields without explanation, a model can learn the wrong patterns with impressive consistency.
A model can detect a pattern. It can't decide whether a one-off customer event changes the business's plan.
If you're assessing whether AI fits a particular finance or operations problem, AI solution design can be considered alongside data quality, oversight and the decision the model is meant to support. Keep operators responsible for the final call.
The Data Readiness Gate Before You Automate Anything
Better software won't fix unclear definitions or unreliable records. Automation can make a poor forecast faster to produce, but speed doesn't make the numbers useful.
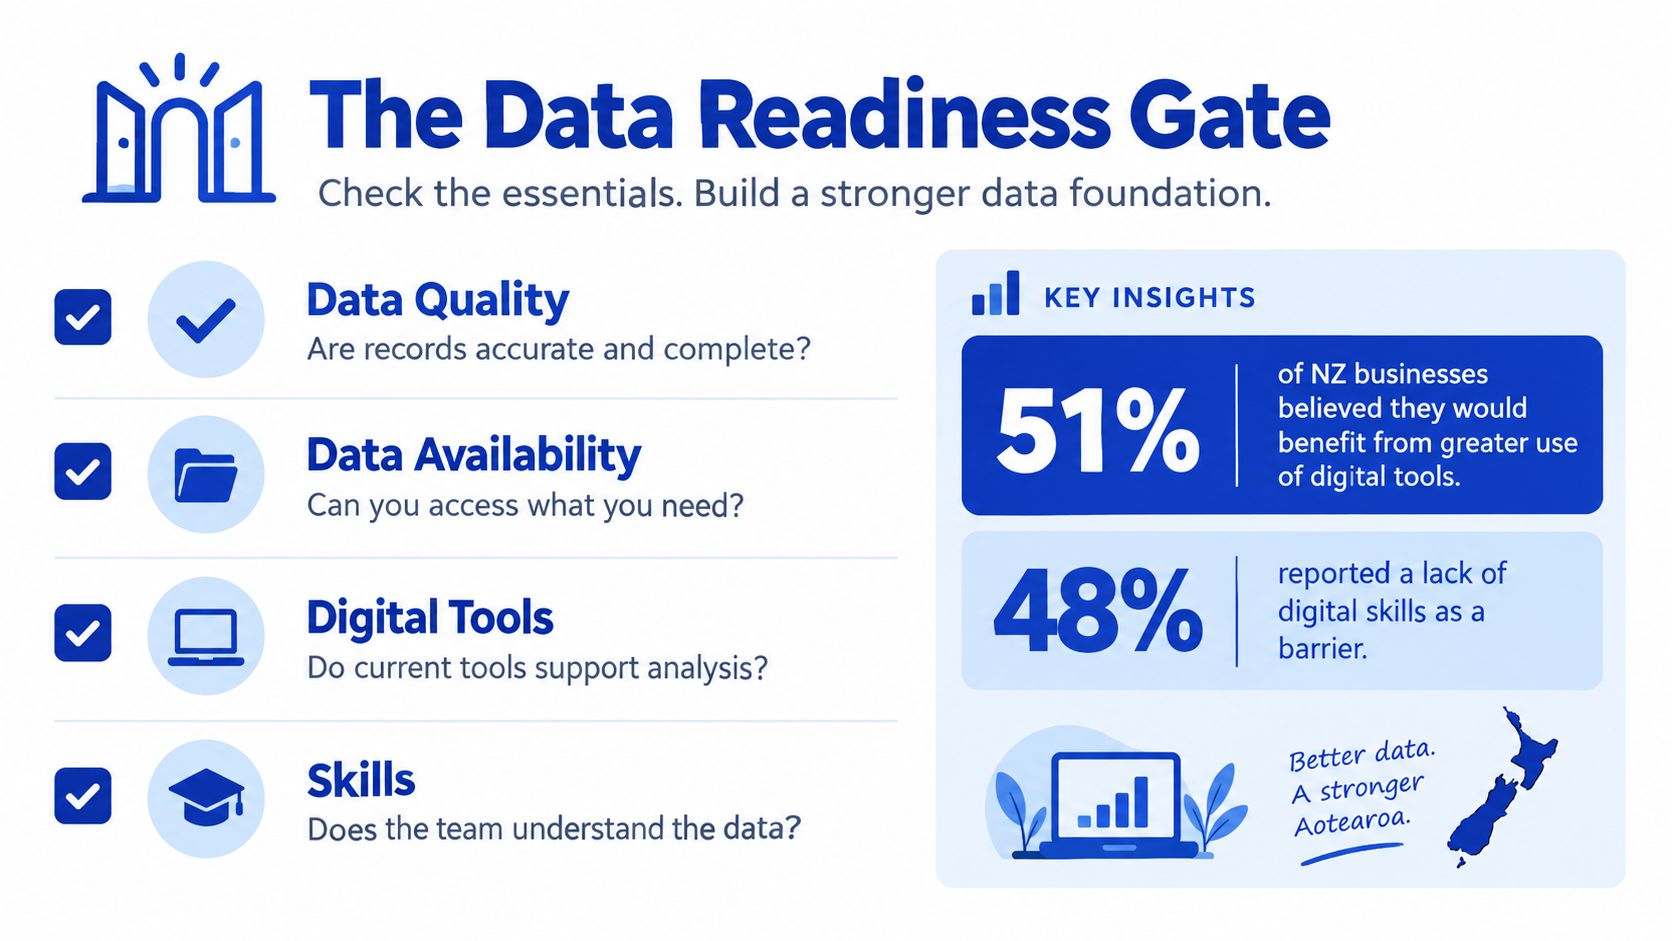
MBIE reported that 51% of NZ businesses believed they would benefit from greater use of digital tools, while 48% said they weren't as digitally enabled as they could be. The same research found that 33% of business owners identified greater use of AI tools as a priority, compared with 21% who identified becoming more digital generally. Commonly cited barriers included affordability, skills, tool selection, time and knowledge (MBIE research on digital capability in New Zealand businesses). Those figures point to a practical issue: a business can want AI before it has the basic processes to use it well.
Put the foundations in place first
Work through a staged readiness gate:
- Standardise definitions and ownership. Agree what the business means by revenue, backlog, pipeline, utilisation and cash. Name the person responsible for each field or metric.
- Reconcile the records. Check that accounting, CRM, project and workflow systems refer to the same customers, work and time periods. Resolve gaps before adding a new layer of analysis.
- Build driver-based forecasts. Connect outcomes to the operating information that influences them, and review whether the drivers are reliable.
- Test AI only when it has a useful job. Start with a focused task such as anomaly detection or scenario generation. Keep a human reviewer responsible for interpreting the result.
Before automating, check for stale CRM stages, duplicate customers, missing costs, undocumented manual overrides and results that nobody can explain. If the team can't identify who changed an assumption or why, pause and fix the process.
Management reporting can help establish consistent visibility into assumptions, actuals and variances; see management reporting support. The investment case should be based on whether the business can improve forecast error, cash visibility or decision speed, not on how advanced the model sounds.
Real NZ SMB Use Cases and the Methods Behind Them
A method becomes easier to choose when it's tied to a real operating decision. The examples below are illustrative patterns, not claims about specific businesses.
A professional services firm is deciding whether to add capacity while customer payments arrive unevenly. Its forecast combines debtor timing, confirmed work and CRM pipeline stages to show how expected receipts and commitments may affect cash. The decision is whether hiring remains manageable under different payment timings. If a major customer delays approval or collections slip, the team revisits the assumptions rather than treating the sales total as cash in the bank.
A retailer is planning stock and rosters around seasonal demand. Store managers contribute current customer and supplier knowledge, while a time-series view of prior sales helps reveal recurring patterns. When current trading diverges from those expectations, managers can adjust purchasing and staffing instead of blindly extending the old pattern.
A trades business wants a more useful view of upcoming revenue than its quote list alone provides. It tracks quote volume, marketing activity and conversion history in a driver-based model, then checks the result against the team's knowledge of project timing and customer intent. If quote quality changes or a channel stops producing suitable enquiries, the assumptions need review before they lead to a spending decision.
A SaaS-adjacent business forecasts customer count, expansion and churn rather than relying on a single top-line revenue figure. That breakdown helps the team distinguish new sales from changes in existing accounts. When customers reduce usage or renewals become less certain, the team can investigate causes and revisit assumptions. For a structured way to find churn root causes, a churn analysis can help separate symptoms from issues the business may be able to address.

Across these examples, the useful pattern is consistent: connect a forecast to a decision, make the assumptions visible and set a clear reason to revisit them. The tool can be a spreadsheet at first. The discipline is what makes it valuable.
Wisely provides Virtual CFO support for forecasting, budgeting and cashflow planning, alongside workflow and data integration services that can help teams improve visibility. If you're ready to build a forecast around the decisions your business faces, visit Wisely to discuss the next step.