At 4.10 on a Friday, the booking system stops responding. The person on the counter has a customer in front of them with a card in hand, and the screen has been spinning for two minutes. What happens next was decided months ago, by whoever built the backup plan and whoever tested it, or didn't.
Some teams keep selling. They have a card terminal on a separate mobile connection, a paper pad, and someone who knows how to mark a booking as pending until the system returns. Others stop trading, ring the IT person, wait, and lose the weekend's takings. Same outage, different outcome.
The gap between those two teams isn't budget. It's whether anyone worked out, in advance, what the business does when a system isn't there. That's what failover and redundancy come down to, and it's testable long before a real outage tests it for you.
What Failover and Redundancy Mean in Plain Terms
Redundancy is having a second thing ready: a spare server, a second internet line from a different provider, a standby generator, a nightly copy of the database. Failover is moving live work onto that second thing, fast, ideally without a person making a decision at the worst possible moment.
A spare tyre in the boot is redundancy. Fitting it on a dark roadside with a jack you've never used is failover.
Plenty of businesses buy the tyre and never open the boot. Then the outage arrives and the spare sits there, useless, because three things are missing. Nobody noticed the primary had failed. Nobody holds the credentials to swing traffic across. Nobody agreed in advance who's allowed to make that call at 4.10pm on a Friday.
Two hours later the system is back, the day is gone, and the story becomes "the backup didn't work". It probably did work. It just wasn't operated.

Failover is judged on time and completeness, not on how many spares are in the rack. A design that shifts traffic in 30 seconds and loses three transactions beats one that shifts in 40 minutes and loses an afternoon of sales. That's the standard to hold suppliers and internal teams to: how long, how much data, and how would we know it happened.
New Zealand adds a constraint that's easy to miss from inside an office. The national lifelines assessment notes that fully duplicated networks are challenging to develop, that some networks contain single points of failure including the Marsden-Wiri fuel pipeline and the Maui gas line, and that 100% security of supply is neither feasible nor affordable. After the Christchurch earthquakes, recovery programmes built "loop" redundancy into the electricity network to give alternative supply paths when one segment fails. The grid, the fibre routes and the fuel supply your systems sit on are not infinitely redundant, which is why your own planning has to carry some of the weight.
If connectivity is the layer you've never duplicated, start with a plain explanation of how to avoid downtime with redundant network links before you buy hardware or sign a contract.
Redundancy is a component. Failover is a behaviour. Resilience is the outcome you get when both hold up under pressure.
Redundancy Patterns Compared at a Glance
Six patterns cover most of what a small or mid-sized organisation will ever need. They run roughly from cheapest and slowest to most resilient and most expensive to operate.
| Pattern | How it works | Switchover time | Relative cost | Best fit |
|---|---|---|---|---|
| Cold standby | Backup copy restored when needed | Hours to days | Low | Archives and reporting tools with tolerable downtime |
| Warm standby | Infrastructure ready, data synced periodically | Minutes to hours | Medium | Business systems with a recovery window of hours |
| Active-passive (hot standby) | Secondary runs idle and takes over on a failed health check | Seconds to a few minutes | Medium to high | Databases, firewalls and core connectivity |
| N+1 | One spare unit covers any one failed unit in a pool | Near instant within the pool | Medium | Power, cooling and network devices |
| Active-active | Both units serve traffic and the survivor absorbs the load | Near zero if capacity is sized correctly | High | Customer-facing services with steady load |
| Geo-redundancy | Duplicate sites or regions with data replicated and traffic steered | Minutes, depending on DNS and replication | High | Disaster recovery across cities or regions |
Read the switchover column as the promise the design makes, not a guarantee. Those are typical ranges from common designs. Your actual figure depends on how the health check is tuned, how DNS time to live is set, and how far behind the replica is running. A test is the only proof, and a design that has never been failed over on purpose is a claim, not a capability.
The cost column is where budgets break. Standby hardware, duplicate licences and idle capacity all cost money while achieving nothing visible, which is why they get cut first in a tight year and noticed first in a bad one. Active-active costs extra capacity headroom rather than extra kit. Geo-redundancy costs a second estate plus replication, and adds the permanent overhead of keeping two environments in step.
Each step down that table buys shorter downtime at a higher, steadier running cost. There's no free rung.
Three patterns cause the most trouble in practice, because each depends on a trigger that's easy to misconfigure: active-passive, N+1 and geo-redundancy. Before locking in a pattern, pressure-test the reasoning behind it against a general software architecture principles guide so the choice survives the next budget review.
The rule of thumb: pick the lowest pattern that meets the recovery target for each system, not the highest one the budget allows. Then write down which pattern each system uses, so nobody assumes the reporting database has the same protection as the payment platform.
Cold standby is often the right answer for archives and reporting tools. Core connectivity, identity and anything that takes money usually need warm standby or active-passive at minimum.
How Active-Passive, N+1 and Geo-Redundancy Work
Active-passive works like a relief driver waiting beside the person at the wheel. The primary system handles traffic while the secondary monitors it. After a set number of missed heartbeats, the secondary takes over the service address, often a floating IP moved by a tool such as Keepalived. The weakness is the health check: a server can answer a ping while its service is failing, so a simple heartbeat may never trigger failover.
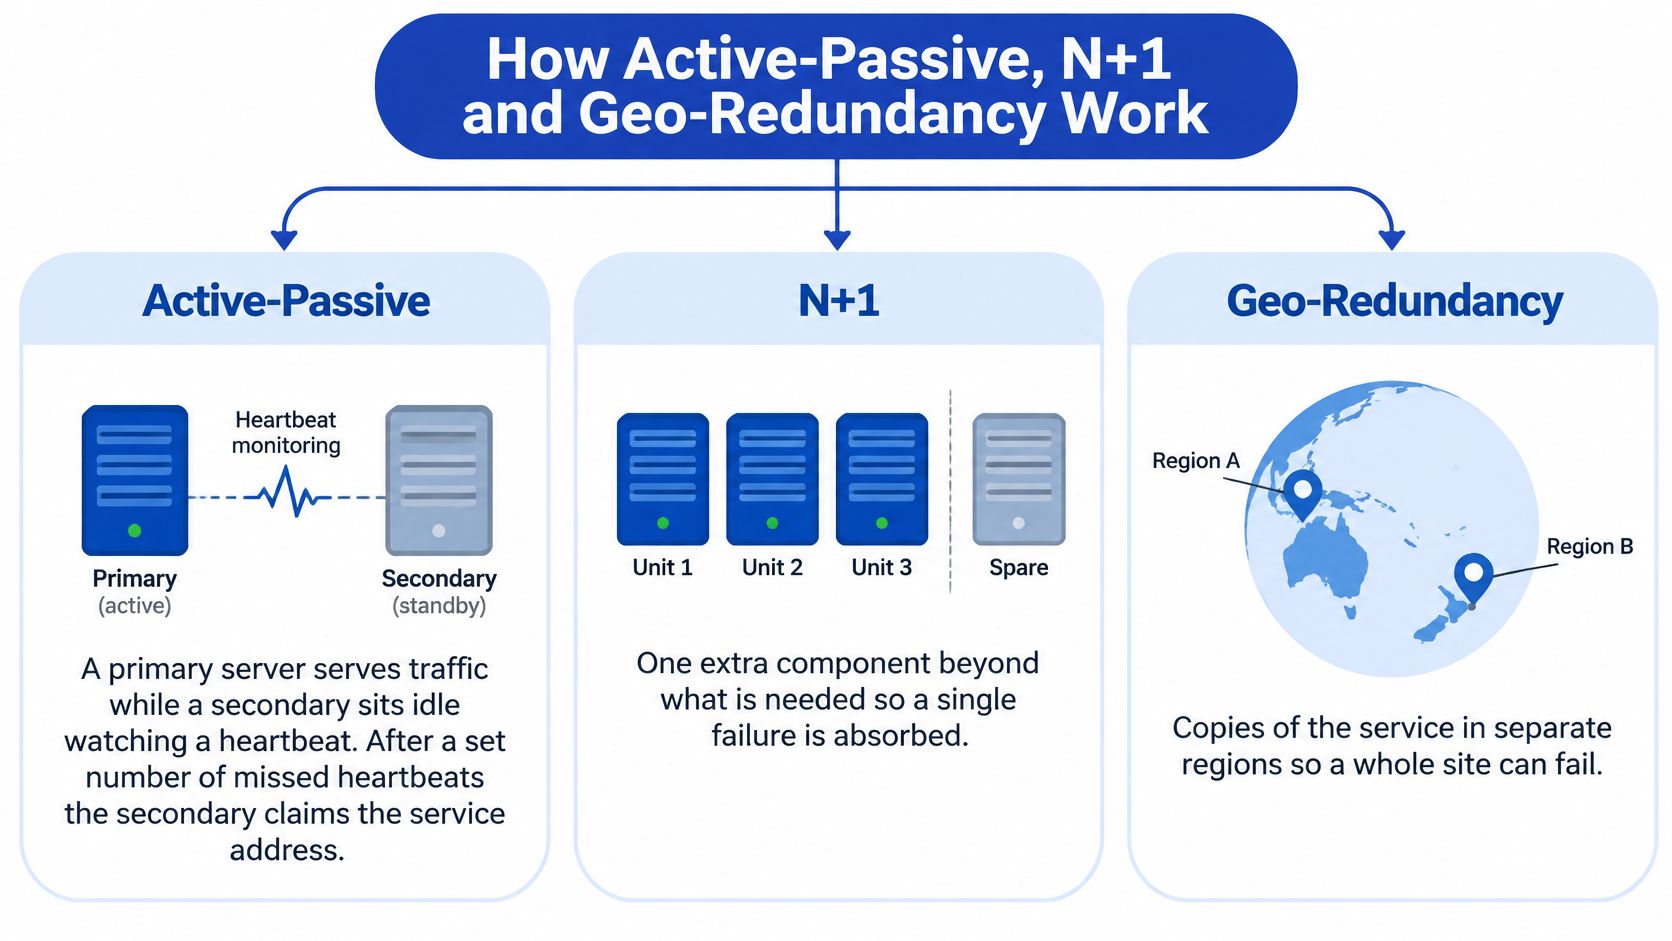
N+1 is a team with one reserve player on the bench. A pool of matching units carries the load, with one spare ready to absorb a failure. For example, four UPS modules can include a spare, or a cluster of three servers can be sized so the remaining servers carry the work if one fails. This protects against one failure at a time, provided the units are independent. Four modules sharing one switchboard, room and cooling system still share the same points of failure.
Geo-redundancy puts a second site or cloud region in a position to take over the service. Data replicates between locations, while DNS or a global load balancer directs traffic. Replication lag determines how much recent data could be lost: an asynchronous copy may be minutes behind. DNS caching can also delay the switch, leaving some users pointed at an unavailable address.
Extra capacity is only useful if the service can operate in a degraded mode while the failed component is repaired. Name who can approve a switch, who communicates with users, and which functions may be paused. A clear decision path can be more useful than duplicating every system, particularly when the business can keep its most important work running on a reduced service.
The four questions that expose a weak design
Ask these about any architecture, whether yours or a supplier's:
- What triggers the switch? If a person must notice and act, the design has redundancy but no automatic failover.
- What state moves with the service? Sessions, file locks, in-flight payments and queued jobs need to be available at the other site.
- What fails together? Check for shared power, fibre routes, identity providers, cloud regions and administrator accounts.
- How would you know it worked? An alert is not proof. Confirm that a customer can complete a transaction on the standby path.
Give the test a runbook: record the trigger, decision owner, switch steps, customer checks and rollback procedure. Then rehearse a controlled failure and confirm the service behaves as intended. Connectivity needs the same attention as the systems above it. Plan a separate path and independent power, and review the available business connectivity options.
Matching Uptime Targets to Real Downtime and Cost
Availability percentages get thrown around in sales meetings as if the difference between them were academic. In hours, it isn't.
| Availability | Downtime per year | Downtime per month | Typical use |
|---|---|---|---|
| 99.9% | 8.76 hours | about 44 minutes | Internal office tools with some tolerance |
| 99.97% | about 160 minutes | about 13 minutes | Business systems with a short tolerable window |
| 99.99% | about 53 minutes | about 4 minutes | Customer-facing transactions |
| 99.999% | about 5 minutes | about 26 seconds | Payment and safety-critical services |
New Zealand has a useful public baseline for what "normal" looks like. The Commerce Commission measures electricity reliability using SAIDI, the average total duration of outages customers experience, and SAIFI, how often those interruptions occur. Its reporting found the large majority of customers had power available for more than 99.9% of the time, with fewer than one interruption in many network areas, and separately that Aurora Energy customers experienced more than two hours of unplanned outages in the year ending March 2024 (Commerce Commission distributor performance reporting).
That's the trap. 99.9% still permits roughly 8.76 hours of unavailability in a 365-day year, and the grid is the reliable part of most stacks. Note also where outages land: an eight-hour total spread across Tuesday nights costs far less than a single hour during peak trading. The Commerce Commission's resilience principles put a national fibre benchmark at about 99.97% availability, which works out to roughly 160 minutes of unplanned downtime a year, before any force majeure event. Set that beside your own target and the conversation gets specific fast.
Turning the percentage into a dollar figure
Estimate the cost of one hour of downtime: lost sales, staff sitting idle, customer credits, overtime to catch up. Then multiply by the hours you expect. Say a booking platform costs $2,000 for every hour it's down and is unavailable for eight hours a year. That's $16,000 of annual exposure you can set against the yearly cost of moving one rung up the pattern table. If the next pattern costs $9,000 a year and cuts expected downtime to one hour, the arithmetic makes the decision for you.
Each extra nine usually costs more than the one before it. That's why the target should follow business impact, not a supplier's default.
Inputs worth writing down for each system: recovery time objective (how long it can be down), recovery point objective (how much data you can lose), the hours that actually matter, and any contractual or regulatory duty to keep it running.
Then read the supplier's service level agreement for what it really promises. It typically measures uptime per month, excludes force majeure events and pays service credits, which offset your subscription rather than your lost trading. Work out your own exposure first. If a plan that has disaster recovery steps written before the event is what you're missing, the paperwork is the cheap part.
One practical habit: put an availability target against each system in writing, name the pattern that meets it, and compare the target with your actual outage log each quarter. Systems drift.
Practical Designs for SMBs, monday.com and Cloud Integrations
Most small businesses have the same four single points of failure: one internet connection, one power supply, one identity provider administrator, and one copy of their data living inside whichever platform they use.
Power is the constraint New Zealanders underestimate. An MBIE resilience paper identifies power cuts as the major cause of telecommunications outages and reports that most cellular sites carry only four to eight hours of battery backup, with a proposal to extend that to a minimum of 24 hours at roughly 200 to 250 additional sites. The engineering lesson is blunt: redundancy without endurance isn't availability. Two network paths sharing one power feed, one road, one repair crew, fail together.
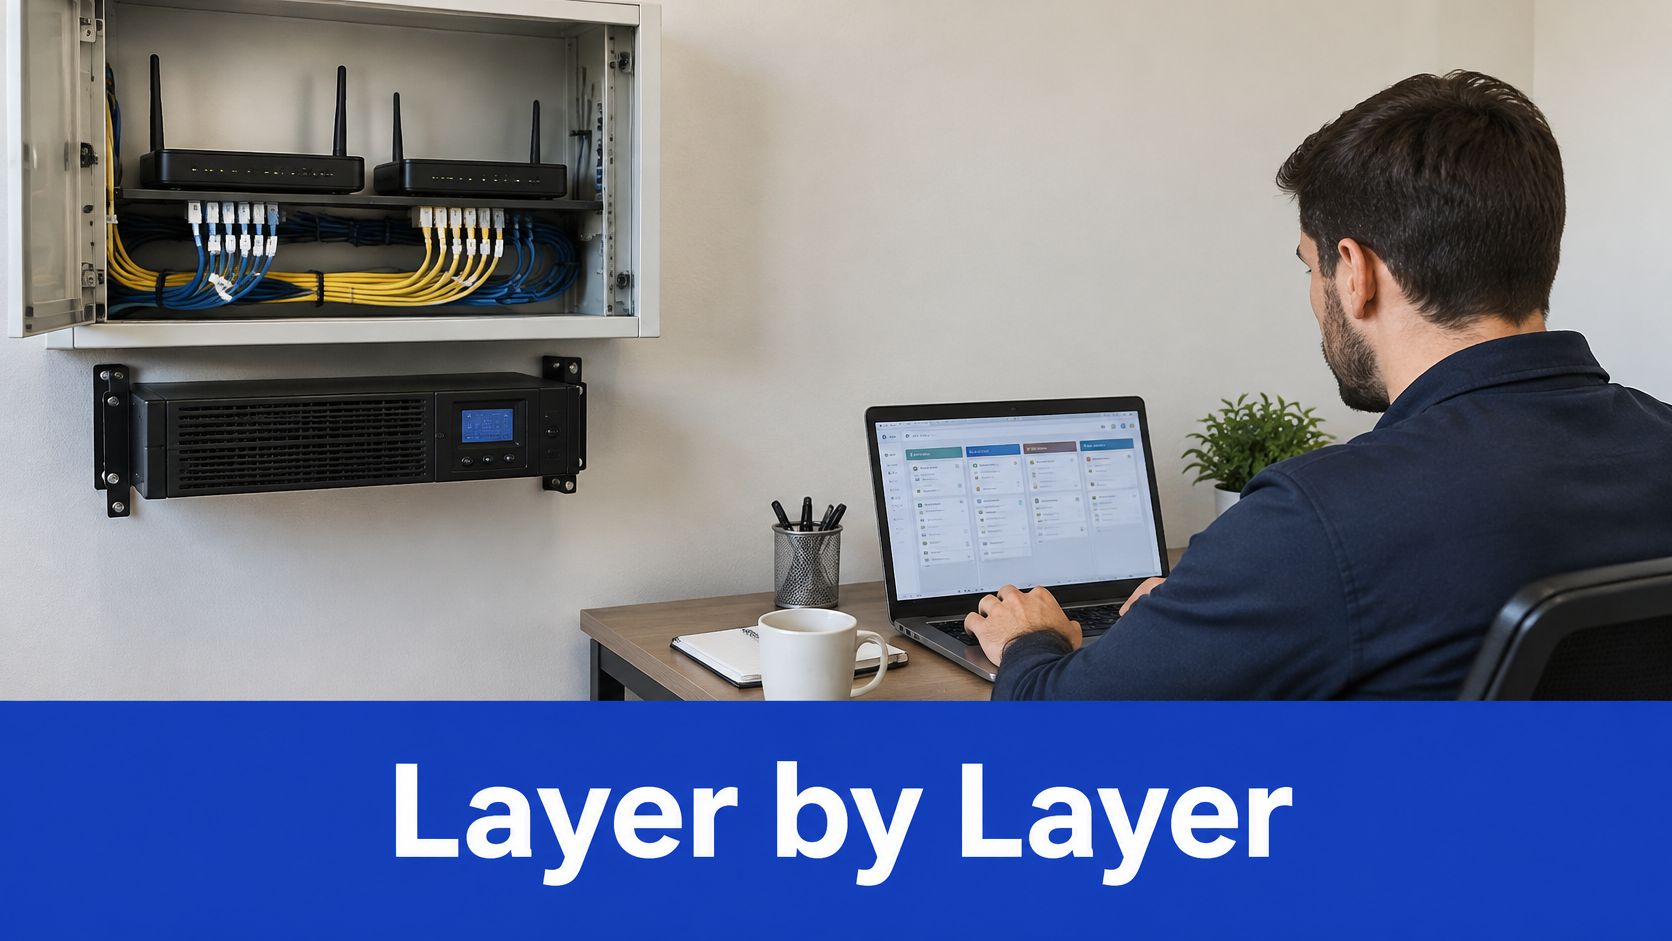
So build layer by layer, and set an autonomy target for each rather than a vague aspiration.
- Connectivity: two carriers on physically diverse routes, each independently powered, with automatic failover that preserves routing, authentication and live sessions rather than just restoring a link light.
- Power: core equipment on UPS, plus generator or extended battery where the site can't function remotely. 24 hours is a sensible stress-test benchmark for essential communications, but the right number follows your recovery time objective and the likely duration of a regional outage.
- Identity: a second administrator account held outside the primary tenant, a documented break-glass procedure, and printed recovery codes stored somewhere that isn't the office.
- Data: scheduled exports of key boards and records to storage separate from the source platform, so a compromised or misconfigured tenant doesn't take the only copy with it.
Where some systems stay on premises, hybrid cloud design keeps both sides able to run if the other is down, and cloud backup and disaster recovery gives you a copy that isn't sitting in the same tenant as the original.
For monday.com and similar workflow platforms, the practical fallback is a shared spreadsheet template with the same fields as your intake forms and approval steps, plus a named owner who can switch intake to it. For integrations, queue failed API calls, retry with increasing delays, and log every failure. A retry that fails three times is worse than one that never ran.
Degraded mode is a design decision, not an emergency improvisation. Decide which processes run on paper or spreadsheets, in what order they resume, and how long that mode can last before real damage starts.
Take a 15-person office. Design A duplicates every system. Design B builds one tested fallback for the three processes that cannot stop, and accepts an afternoon of inconvenience on the rest. Design B usually costs less and holds up better, because the fallback has been rehearsed and the duplication hasn't.
Testing, Drills and Monitoring That Prove Failover Works
A network diagram can show a backup path, and a log can report that a backup completed. Neither proves your team can keep work going when the main system fails. The useful evidence is a recorded test: work moved to the standby path, people knew what to do, and the process continued within its recovery targets.
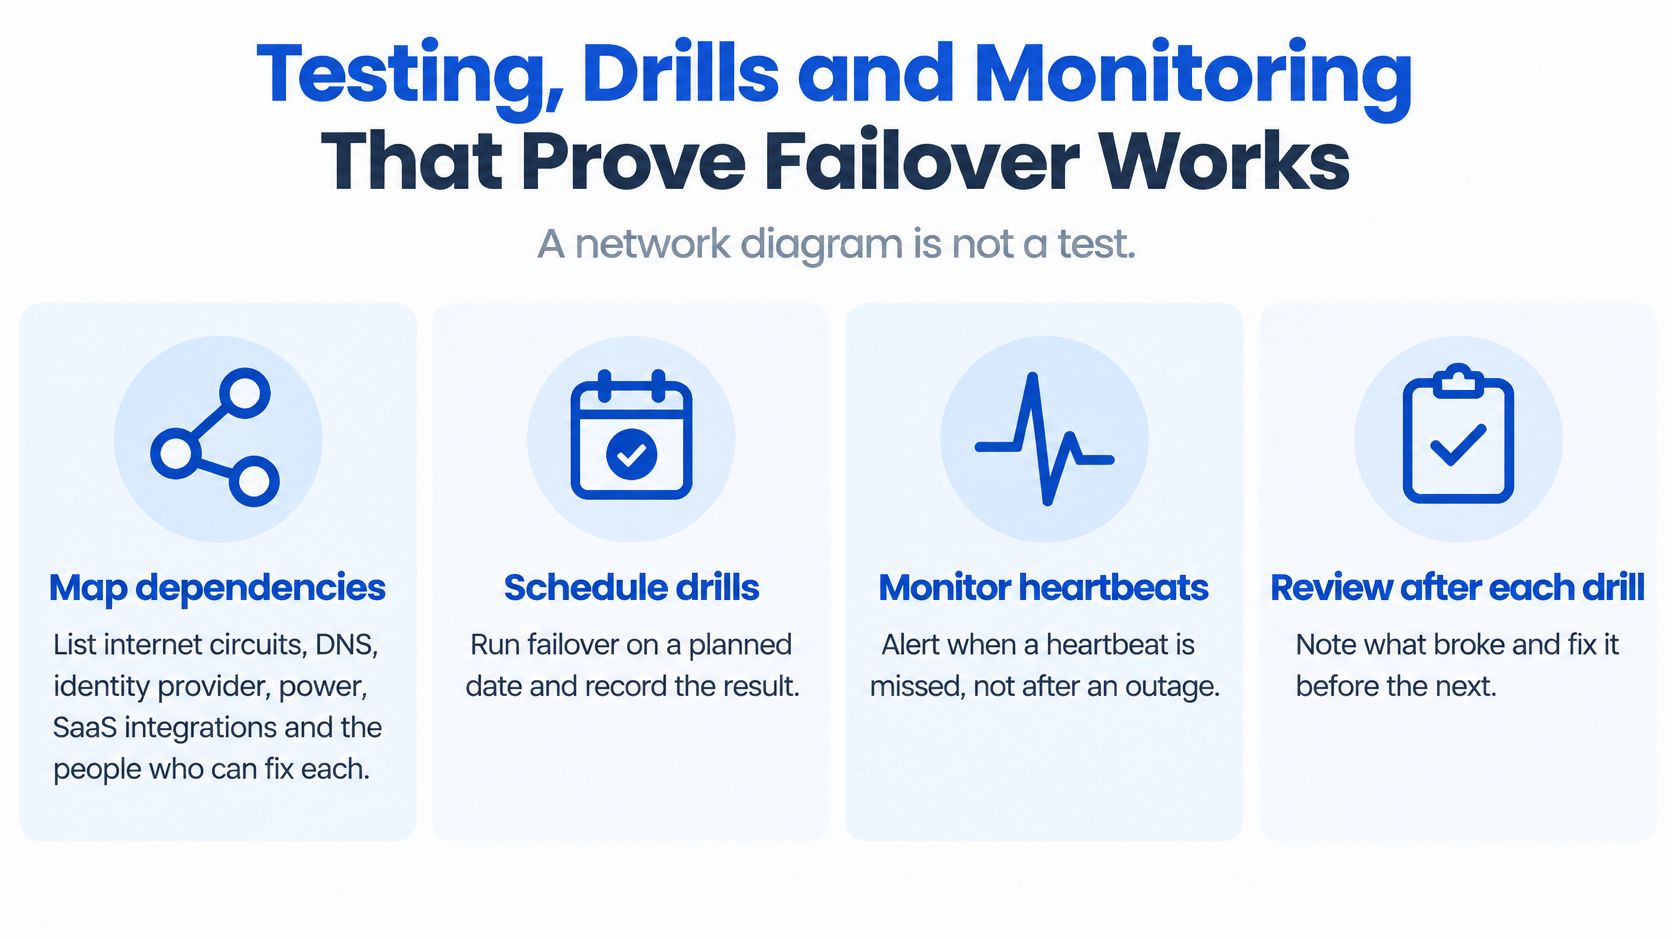
Map dependencies before you buy anything
For each critical service, list what it depends on: the internet circuit, DNS, identity provider, power, SaaS integrations, and the person responsible for restoring each part. A standby system can still be unusable if it relies on the same failed identity service or nobody has authority to switch over.
The National Cyber Security Centre's cyber threat report news release warns that digital supply-chain compromises have caused major incidents in New Zealand, affecting business operations and potentially exposing personal or identity data belonging to hundreds of thousands of users. The release also reports that 110 of 1,037 incidents not requiring specialist technical support affected organisations in Q2 2026. Across 291 reports that specified an amount, reported direct financial losses totalled NZ$2.7 million. Small organisations appear in these incident figures too, so resilience planning should include suppliers and the services they provide.
Run drills in rising order of cost
Begin with a backup restore. Restore data into a clean environment, then check that it matches the source. Next, fail one component during a low-traffic window and observe what monitoring reports. After that, test a full failover for one critical process. Record each step from the user's perspective, not just the technical team's.
A final, inexpensive exercise tests decisions rather than infrastructure. Set aside 60 minutes for a tabletop drill with the people who have authority to act. Walk through a supplier outage lasting a working day: who declares degraded mode, what work continues, and who contacts affected staff? A tested fallback for the most important process may serve the business better than duplicating every system, particularly when the duplicated systems have never been rehearsed.
Watch for the failures that stay quiet
Some failures are visible immediately. Others build without a clear alarm: missed heartbeats, rising replication lag, an overnight backup failure, a certificate approaching expiry, a filling disk, or a stopped service that still appears to answer. Each can turn a manageable fault into an outage if nobody notices in time.
Wisely's monitoring raises alerts when disks fill, backups fail, certificates expire or services stop. Those checks help teams spot quiet faults early, but alerts only help if someone is responsible for responding and knows what action to take. Test the alert path as well as the failover path.
Cyber recovery isn't the same as high availability
A second live environment can keep a service available through an equipment failure. It cannot, by itself, make compromised data safe. The NCSC cyber threat report recorded 369 incidents of potential national significance in the 2025/26 financial year, including 162 linked to criminal or financially motivated actors, an 18% year-on-year increase, and four classified as highly significant. The report also describes the February 2026 compromise of the MediMap medication-management platform, which disrupted normal medication distribution while the system was offline.
Automatic failover can copy corrupted data or an attacker's access into the second environment. Recovery therefore needs more than a live duplicate: check that restored data is clean, practise restoring into an isolated environment, separate privileged access, and document how to roll back. Consider degraded operation too. Your platform may be available while an API, payment provider, email tenant or identity service is not.
The eight-step first drill
- Pick one process and write its targets. Choose a process whose interruption stops revenue or service, such as taking bookings. Record its recovery time objective and recovery point objective in hours.
- Map its dependencies. List the circuit, DNS records, identity provider, workspace platform, payment gateway and administrator credentials.
- Name the decision rights. Identify who can switch to manual processing and who can isolate a system during a suspected compromise. Name a deputy for each role.
- Write the manual workaround. Specify the steps, the forms to use and an offline contact list that remains accessible if the affected system is down.
- Simulate a provider or identity outage and time each step. Use a stopwatch. Record delays caused by missing information or unclear authority.
- Check what came back. Compare restored data with the offline record, and confirm that privileged access is separated from the affected environment.
- Log results, gaps and owners. Give every gap a named owner and a due date.
- Fix the top three gaps and re-run within a month. A drill without follow-up fixes does not demonstrate readiness.
If the team needs a shared reference for how failover is intended to behave, use a walkthrough before running the drill.
Keep the evidence together: a named owner for each system, targets for each process, the documented workaround and a dated drill record. Customers, insurers and auditors increasingly ask for proof of testing. A supplier's uptime certificate does not show whether your team can switch to its fallback and keep work moving.
Wisely supports the systems a client already runs, without requiring a move to a preferred technology stack. Its helpdesk, cloud, software development and security services sit under one roof, so one supplier is responsible when a drill identifies a gap. Teams that need help with monitoring and runbooks can learn about managed IT support.
Schedule the first drill around one process this quarter, then set the next one before the first is complete. Repeating the exercise helps the team build a usable routine, while each recorded result shows which gaps still need attention.