You're looking at the bank balance, the sales pipeline, and next month's payroll, and asking the same question most owners ask at some point: how much do we need to sell before this business starts paying for itself?
That's the job of break even analysis. Not to satisfy an accountant. Not to fill out a spreadsheet tab you never open again. It gives you a hard operating line between “busy” and “profitable”.
For a lot of NZ businesses, that line moves more often than they expect. Costs shift. Imported inputs rise. Staffing changes. Sales timing slips. A break-even figure that looked fine at the start of the quarter can be wrong by the end of the month. That's why static models often create false confidence.
What Is Your Business Profit Point
A founder might finish a strong sales month and still feel pressure on cash. An agency owner might have recurring clients yet wonder why profits never seem to match revenue. A product business might increase orders and find that higher volume hasn't solved anything. In each case, the same issue sits underneath it. They don't have a clear, current view of their profit point.
That profit point is your break-even point. It's the level where total revenue equals total costs. Below it, you're funding the gap. Above it, each additional sale starts contributing to profit.
The useful part isn't the textbook definition. It's what the number lets you decide. You can test whether pricing is too low, whether overhead has become too heavy, whether a new hire is affordable, and whether a product line is worth keeping.
For online sellers, this matters even more when platform fees, fulfilment, and promotions blur the difference between revenue and actual margin. If you sell through social commerce channels, this TikTok Shop profitability guide is worth reading because it shows why revenue can look healthy while contribution margin stays weak.
Break even analysis is where operational reality meets financial truth.
Done properly, it becomes a decision tool. Done poorly, it becomes a stale spreadsheet that tells you what was true three months ago.
Understanding Your Fixed and Variable Costs
Most break-even problems aren't calculation problems. They're cost classification problems. If you put the wrong expenses in the wrong bucket, the answer looks precise but leads you in the wrong direction.
Fixed costs are the bucket
Fixed costs don't move directly with sales volume in the short term. Rent, software subscriptions, base salaries for admin staff, insurance, and core platform costs usually sit here. Whether you sell one unit or one hundred, those bills still arrive.
In the NZ context, this matters because fixed costs can be heavy. The NZ Small Business Trust reference on break-even risk notes that median fixed costs often comprise 45-55% of total operating expenses, and for a typical NZ firm, a 10% increase in variable costs raises the break-even point by approximately 18%.
That second point catches owners out. They assume a cost increase creates a similar-sized problem. It doesn't. Once margins are tight, a modest rise in unit cost can force a much larger increase in required sales.
If you're still treating accounting support as only compliance work, it's worth looking at how firms structure business accounting support and reporting workflows. Clean cost categories are the base layer for any break even analysis that you'll trust.
Variable costs are the tap
Variable costs move with delivery, production, or sales. Raw materials, packaging, freight, direct labour tied to output, payment processing fees, and sales commissions usually belong here.
A simple way to explain this to operators is the bucket-and-cup model:
- Your fixed costs are the bucket you must fill every month.
- Your contribution margin from each sale is the cup of water.
- Your variable costs reduce how much water is in each cup.
If the cup gets smaller, you need more sales to fill the same bucket.
Contribution margin is what pays for the business
This is the number owners should watch more closely than revenue. Contribution margin is selling price minus variable cost. It tells you how much each sale contributes toward covering fixed costs.
Here's the practical distinction:
| Item | What it tells you | Why it matters |
|---|---|---|
| Revenue | How much you sold | Useful, but incomplete |
| Gross activity | How busy the team is | Can hide weak pricing |
| Contribution margin | What each sale contributes after direct costs | Core driver of break-even |
| Net profit | What's left after all costs | Final result |
A business can be growing revenue and still going backwards if contribution margin is too thin. That's why break even analysis works best when finance and operations use the same cost logic.
How to Calculate Your Break-Even Point
Once your costs are sorted properly, the maths is straightforward. The judgement is in choosing realistic inputs.
A simple visual helps if you want to explain this to a team member or another director.

The two formulas that matter
Use break-even in units when you sell a defined product or package:
Break-even point in units = Fixed Costs / Contribution Margin per unit
Use break-even in revenue when units vary or when you care more about sales dollars than item count:
Break-even revenue = Fixed Costs / Contribution Margin ratio
Where:
- Contribution margin per unit = Selling price per unit minus variable cost per unit
- Contribution margin ratio = Contribution margin divided by revenue
A worked NZ example
For a NZ-based tech firm with $200,000 in fixed costs, a $100 unit price, and $40 variable cost, the break-even point is 3,333 units. The NZIER example on localised break-even calculations) also notes that applying the 28% corporate tax rate and other local factors can increase that by over 10% to 3,670 units.
That's the difference between a generic online calculator and a localised model. Generic tools assume a clean margin. Real businesses don't operate in a clean margin environment.
A useful way to work through your own numbers is:
List annual or monthly fixed costs
Include rent, core salaries, subscriptions, insurance, debt servicing overhead, and baseline admin costs.Set a realistic selling price
Use the actual average price after discounts, not the list price you wish you achieved.Calculate variable cost per sale
Include direct labour, freight, materials, transaction fees, and any fulfilment cost that rises with volume.Find your contribution margin
This is the amount each sale contributes to covering fixed overhead.Run the formula and test scenarios
Don't stop at one answer. Test price pressure, slower sales, and cost increases.
The video below gives a simple primer if you want a quick refresher before modelling your own numbers.
What owners often get wrong
Practical rule: build your break-even model on actual realised price and actual delivered cost, not quoted price and hoped-for cost.
The most common mistakes are familiar:
- Using average revenue too casually when margins differ by client, channel, or product
- Ignoring NZ-specific cost layers that change the true fixed-cost base
- Leaving out service delivery time in service businesses
- Treating one-off overheads as permanent, or permanent overheads as one-offs
If the model feels too neat, it probably is.
Charting Your Path to Profitability
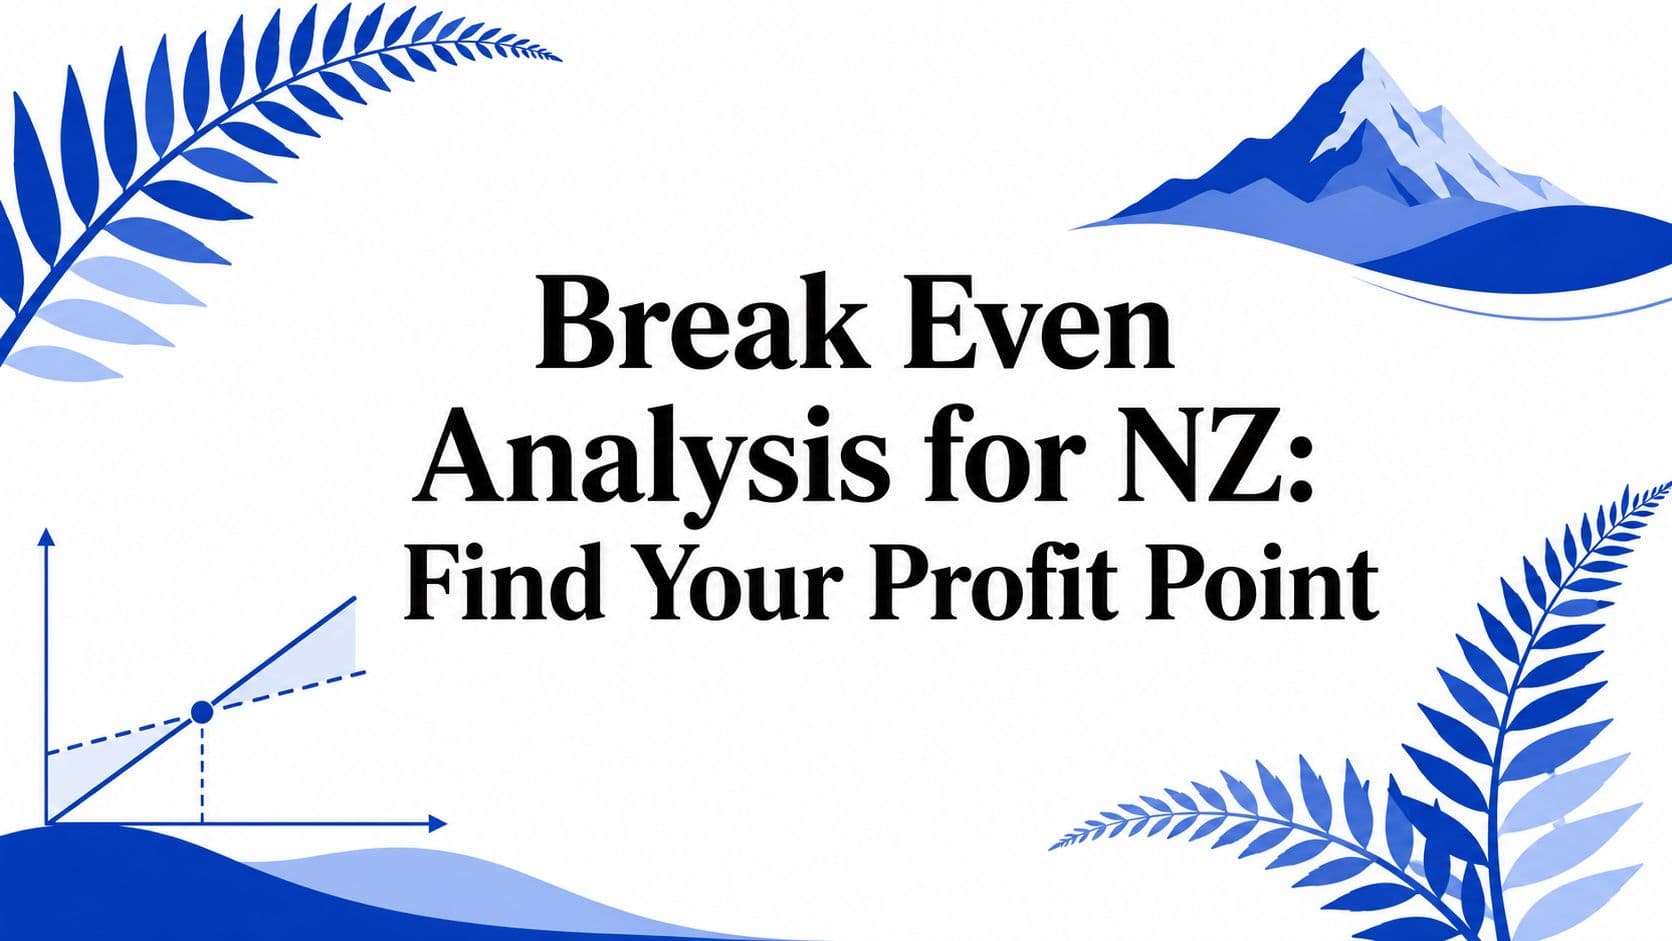
Some owners understand break even analysis faster when they see it on a chart instead of in a formula. That's useful when you're explaining decisions to a leadership team, lender, or board.

How to read the chart
A standard break-even chart uses three lines:
Fixed costs line
This starts above zero and stays flat because those costs don't change with unit volume in the short term.Total costs line
This begins at the fixed-cost line and slopes upward as variable costs increase with each sale.Total revenue line
This starts at zero and rises as sales increase.
Where the revenue line crosses the total cost line, you hit break-even.
What the visual tells you quickly
Below that crossover point is the loss zone. Above it is the profit zone.
That sounds obvious, but the chart does something useful that a single formula doesn't. It shows how steeply costs are climbing relative to revenue. If the cost line is rising too fast, your problem may not be sales volume at all. It may be direct cost inflation, underpricing, or weak delivery efficiency.
A chart also makes trade-offs visible:
| If this changes | What the chart usually shows |
|---|---|
| Fixed costs rise | Break-even shifts further right |
| Variable cost rises | Total cost line steepens |
| Price improves | Revenue line steepens |
| Sales slow | Time to reach break-even stretches |
A good break-even chart gives operators a picture they can act on. It stops the conversation from becoming abstract.
For internal planning, I like charts because they separate two very different problems. One is not selling enough. The other is selling enough volume but not enough margin. The response to each problem is different, and the chart exposes that quickly.
Strategic Decisions with Break-Even Analysis
Once the number is in place, the better question is: what decision are you using it to make? Break even analysis is most useful when it becomes a way to test choices before you commit money, headcount, or pricing.
Pricing and overhead trade-offs
Say you're considering a price increase. The obvious risk is customer resistance. The less obvious upside is that a stronger contribution margin lowers the sales volume needed to cover fixed overhead. That gives you more room to absorb disruption.
The reverse is also true. If you discount too aggressively, you don't just lose margin on one sale. You raise the amount of future selling required to break even.
When a business wants to add a role, lease extra space, or invest in a new system, I usually want to know three things first:
- How much new fixed cost are we adding
- How much extra contribution margin must sales generate to carry it
- How long can cash absorb the gap if revenue arrives late
That's where strategic planning and financial modelling need to meet. A proper strategic planning process for growing businesses should tie operating choices back to a break-even view, not leave them as separate conversations.
Margin of safety matters more than most owners think
Break-even tells you where the line is. Margin of safety tells you how far away from that line you currently are.
If your current sales sit only slightly above break-even, the business is exposed. A delayed project, a supplier increase, or a weak month can erase the buffer quickly. If your gap is wider, you have room to make decisions calmly instead of reactively.
Don't ask only, “Are we above break-even?” Ask, “How far above it are we, and how fast could that change?”
That question usually produces better management behaviour.
Service and subscription firms need a different lens
Many NZ businesses don't sell neat, countable units. They sell retainers, recurring support, project bundles, managed services, or subscription access. In those businesses, the “unit” in break even analysis is often a client, a retainer, or a billable capacity block.
That changes the conversation. Instead of asking how many widgets you must sell, you ask things like:
- How many active retainer clients cover the fixed team cost
- How much delivery capacity each account consumes
- Whether client acquisition cost is being recovered fast enough
- Whether low-priced retainers are blocking higher-margin work
For service firms, break-even analysis fails when it ignores utilisation and delivery time. A retainer can look profitable on paper and still be loss-making once actual service hours are counted.
Automate Break-Even Analysis in Your Workflow
The biggest weakness in most break-even models isn't the formula. It's the update cycle. If someone revisits the spreadsheet once a quarter, the result is historical, not operational.

That matters because NZ businesses are already moving toward workflow-led operations. The NZ Tech Adoption Report and Reserve Bank of NZ reference on real-time adjustment notes that 55% of NZ SMEs are adopting workflow automation in 2025, and 37% of SMEs failed their projections during shocks because they couldn't adjust models in real time.
What static spreadsheets do badly
A spreadsheet usually captures one moment. It rarely reflects what's happening across sales, delivery, inventory, staffing, and finance at the same time.
That creates predictable problems:
- Sales teams quote deals using old cost assumptions
- Operations absorb scope creep without margin visibility
- Finance updates forecasts late because inputs arrive manually
- Leaders make pricing decisions after the margin damage has already happened
At this point, workflow tools become financially useful, not just administratively tidy.
What a live break-even dashboard looks like
In a platform like monday.com, you can treat break even analysis as a live metric fed by multiple boards and systems. The logic is simple even if the setup takes care.
A practical design often includes:
| Workflow input | What it feeds |
|---|---|
| CRM pipeline board | Expected revenue and timing |
| Delivery or project board | Resource usage and service effort |
| Inventory or procurement board | Current unit costs |
| Finance system data | Fixed overhead and actual spend |
From there, a dashboard can calculate current contribution margin, required sales to break even, and how those figures shift when assumptions change.
For example, if supplier cost rises, expected gross margin falls. If gross margin falls, the break-even target rises automatically. If sales velocity also slips, management sees the problem early instead of at month-end.
How to make automation useful instead of noisy
Not every metric deserves automation. Break-even does, because it connects commercial activity to financial resilience.
A workable setup usually follows these principles:
Use one agreed cost logic
If sales, operations, and finance define costs differently, automation just spreads confusion faster.Pull from live systems where possible
Don't rely on manual copy-paste if the information already exists in Xero, your CRM, or project boards.Show thresholds, not just totals
Highlight when margin drops below acceptable levels or when forecast sales no longer clear break-even.Make the number visible to decision-makers
A dashboard that only finance sees won't change quoting, staffing, or delivery behaviour.
If you're building a more connected operating model, monday.com and Xero integration workflows are one of the most practical ways to connect activity data with finance data. For teams exploring broader automation options around admin and reporting, this roundup of AI tools for automating business tasks is a useful starting point.
The goal isn't a prettier dashboard. The goal is catching margin pressure while there's still time to respond.
From Calculation to Confident Forecasting
A solid break even analysis gives you more than a number. It gives you a way to think. You stop judging the business by revenue alone and start managing the relationship between cost structure, pricing, and sales volume.
That changes how decisions get made. Hiring becomes a break-even question. Discounting becomes a break-even question. Product mix, client mix, delivery design, and channel strategy all become break-even questions. That's a healthier way to run a business because it ties ambition back to financial reality.
It also improves forecasting. When break-even sits inside your operating rhythm, forecasts stop being broad guesses and start becoming live management tools. If you run a service business, a good budgeting discipline helps connect growth plans to capacity, margins, and cash timing. This guide on how to improve financial planning for service business growth is a worthwhile reference for that broader planning mindset.
The businesses that use break even analysis well don't treat it as a one-off exercise for lenders or year-end planning. They build it into weekly and monthly decision-making. They revisit assumptions. They connect the model to real activity. They make it visible.
That's the shift that matters. Move from static calculation to active control, and break even analysis becomes a practical management system rather than an accounting formula.
If you want help turning break even analysis into a live decision tool, Wisely can help design the financial model, connect it to your workflows, and build the reporting discipline behind it. That includes Virtual CFO support, forecasting, and workflow integration so your team can see profit risk early and act on it with confidence.